A few months ago (when we still thought we were about to release 0.3 “real soon now” ;), I noticed that Specto is noticeably slow to start up, even on warm starts (when it is not the first time you launch it). It always takes at least 6 seconds to paint the list of watches and start refreshing them. During that time, there is a notably high CPU usage spike (surprisingly, no noticeable hard drive I/O), as shown below:
![]()
I talked about this problem with Wout when I first found out about it, and looked at various profiling tools (sysprof, oprofile, valgrind…), but could not find anything that was supposed to work with Python directly, let alone anything a mortal could use. Thus, we shrugged, and the problem sat there without further investigation, lacking the tools (and time) for that.
Tonight, I wanted to be the next Federico Mena Quintero, and so I tried it again. My first hypothesis was that Specto surely must be doing way too much work, or doing inefficient I/O in some way. I consider it unacceptable that a simple application like Specto does not launch instantly, instead taking as much time as a warm-start OpenOffice.
If you don’t know about software performance profiling, there is some truly awesome “hecho in Federico” material that you must see first. It is easy to understand and funny as hell:
- http://ftp.belnet.be/mirrors/FOSDEM/2007/FOSDEM2007-ProfilingDesktopApplication.ogg
- http://www.gnome.org/~federico/docs/2005-GNOME-Summit/html/index.html
- http://www.gnome.org/~federico/docs/2006-GUADEC/how-much-faster/index.html
So, tonight, I tried Googling for once, and immediately discovered that Python 2.5 already has three official profiling modules! Aided by the quickstart guide, I found to my great delight that I could simply run cprofile over the entire application (since I’m only interested in the startup anyway), instead of butchering the code and wasting tons of time on getting it working.
The normal command that launches Specto if you use “launch.sh” is like this:
PYTHONPATH=$PYTHONPATH:src ./specto $@
The command I used to do the profiling is this, instead:
PYTHONPATH=$PYTHONPATH:src python -m cProfile -s 'cumulative' specto $@ >profile-cumulative.txt
This launches Specto, and when it finally appears and starts refreshing its watches, I immediately hit the “Stop” button and close Specto with a keyboard shortcut, to profile just the bare minimum I need.
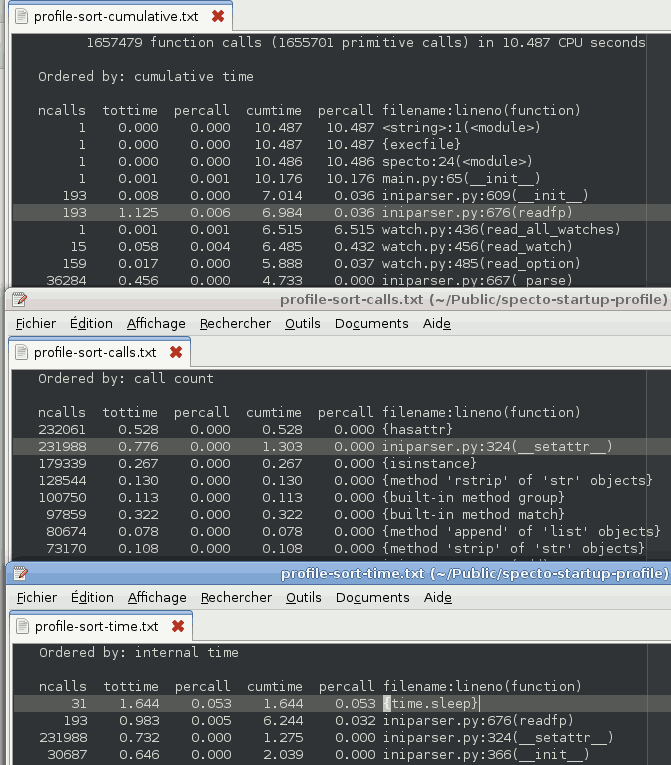
I repeated this command with “cumulative”, “time” and “calls” to change the sorting order of the results (other sorting orders are possible).
The results confirmed (it seems) my hunch: iniparser (the module that reads/writes the watch list) is likely the bottleneck: out of the 10 seconds of run time (running the profiler slows things down a bit), about 7 seconds seems to be eaten by iniparser (cumulative time). Now, I’m no profiling guru, so bear with my sloppy analysis, I may be completely wrong here, but I will highlight the parts that seem to me like they are problematic:

Look at all that crap! It must be doing some serious sh** to be able to run over 213 thousand function calls and hog the CPU (a Pentium 4, 2.4 GHz) for over 7 seconds…
Remember Federico’s law? Trim the fat in this order (after having asked the profiler):
- Excess work
- Excess I/O
- Bad algorithms
- Bad memory access patterns
- Micro-optimizations (function call overhead, mis-predicted branches, CPU-level foo)
… and it seems like Specto’s iniparser module is doing a lot of “excess work”. At the same time, why is “time.sleep” eating 1.6 seconds of our startup time? If I recall correctly, we don’t actually use a sleeping timer during startup before the watches start refreshing. This could be another path of investigation.
Now what? Throw iniparser away? I guess not, not until someone sits down and actually investigates (better than what I did here):
- What to blame: our code, or iniparser? We should look in Specto’s code, to see if there is some dumb/flawed logic, like “open and read the file each time for every watch”.
- If iniparser is at fault, can it be optimized, or must it be replaced by some other data storage method?
So, this concludes my initial blog post on profiling Specto. I have here identified some potential performance bottlenecks, and I would appreciate any help or feedback on analyzing this issue more accurately. If someone wants to actually tackle the problem, you’re more than welcome. I personally don’t have time, at least not until Christmas holidays, and even then, I can’t promise anything.
Comments
2 responses to “Profiling Specto (and whole Python applications in general)”
Hmmm interesting,
I looked at the Watch_io class in watch.py and it seems that we use self.cfg = ini_namespace(file(self.file_name)) every time we read a watch and for every option in the watch we execute it again…
This is done so we are sure that we always have the newest information, but we should look where we can remove these calls.
Perhaps you can try configparser if iniparser is too slow?