When you load a project in PiTiVi, importing the clips into the “media library” (also known internally as the “source list”) is pretty fast, but inserting them in the timeline is painfully slow. So I whipped out my torture test project and spent some time profiling what’s going on using Python’s cProfile module (I talked about it before, but see also this well-written page from the GTG folks).
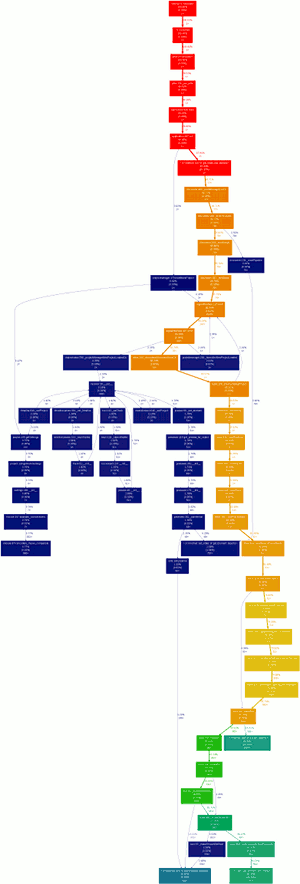
The findings were interesting. Graphically, we end up with something like this:

Looking at where the time was spent, near the bottom of that graph, I suspected that linking was the root of the evil we saw.
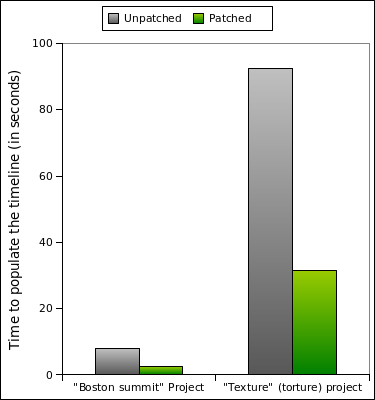
Not long after I posted my findings, Edward posted an initial patch that makes it three times faster. Here are some measurements:

| Unpatched | Patched | |
| “Boston summit” Project | 7.9 seconds | 2.5 seconds |
| “Texture” (torture) Project | 1 min 32.4 seconds | 31.4 seconds |
(Insertion times exclude the time to import clips to the source list)
As hinted by a new version of the profiling graph, there probably is more work left to do, but this patch at least makes things more bearable. A problem is that Python’s cProfile can’t really introspect what’s going on in the “add” method of gst.Bin… Also, if anyone feels like hacking on a nice little project to get familiar with PiTiVi, may I suggest better loading progress indication? 😉
Comments
2 responses to “Improving project loading performance”
Great work Jean-François!!!
your love for PiTiVi will make the differece!
I hope to have time for PiTiVi in the near future…
Excellent work 🙂